In industries where uptime and safety are critical, predictive maintenance can save thousands. Analysing vibration signatures of various industrial equipment helps understand the health of the system and prevents unexpected failures, regulatory breaches, and environmental risks.
Let’s take a look at what is meant by vibration signatures and how they can be used to facilitate maintenance decisions.
What Is a Vibration Signature?
A Vibration Signature is a unique and measurable pattern of vibration data generated by a particular machine, structure, or component. Assessing the vibration signature reveals the overall condition of the machine as well as individual components. Thus, it acts like a fingerprint for machine health.
The types of data measured in a vibration signature are frequency, amplitude, phase, and acceleration. Analysing these can help identify anomalies like unbalance or bearing wear, and predict potential equipment failures.
This makes it easy to undertake diagnostic analysis and plan and implement predictive maintenance, thus avoiding costly downtime. Further, deviations such as increased amplitude, frequency shifts, or irregular patterns can indicate early signs of faults and failure.
The types of equipment this applies to include compressors, fans, pumps, HVAC systems, and those with structural elements.
How Vibration Analysis Works
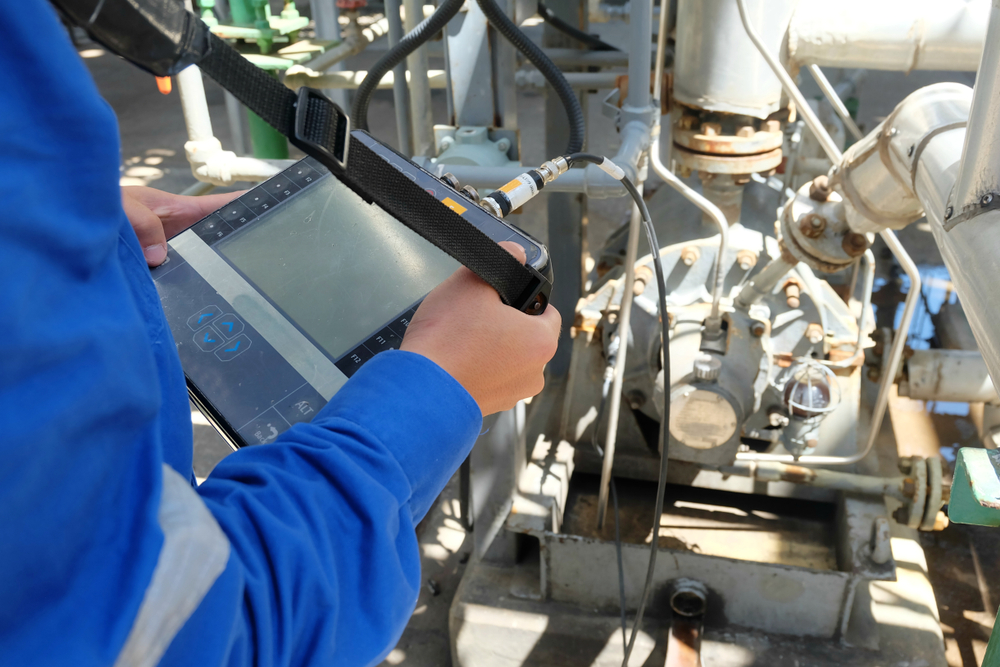
Vibration sensors installed in and around key machinery capture raw vibration data and convert it into electrical signals. Using a mathematical tool called the Fast Fourier Transform (FFT), this vibration data is broken down into its individual frequency components, creating a vibration spectrum.
This frequency-domain view allows engineers and technicians to pinpoint the sources of vibration. Usually, these include a specific bearing fault, an imbalance in a rotating component, or a combination of these.
Why Vibration Analysis Matters in Maintenance
Vibration monitoring is an important and effective predictive maintenance strategy that helps avoid unexpected breakdowns and safety hazards.
The key benefits of taking up regular and thorough vibration analysis are as follows:
- Early fault detection in key machines, like gear defects, imbalance, misalignment, and loose parts.
- Reduced unplanned downtime due to equipment failures.
- Cost savings through lower overall maintenance costs and less waste.
- Extended equipment life through addressing wear and tear.
- Improved operational efficiency through fewer breakdowns, improved productivity and product quality, and consistent performance.
- Conducting root cause analysis of vibration-related problems in industrial machinery for effective solutions.
- Safety assurance through minimising the risk of accidents from malfunctioning machinery.
- Regulatory compliance with industrial and workplace safety standards set in Australia
In addition, this also facilitates vibration-related environmental compliance through risk assessments, baseline surveys, threshold setting, continuous monitoring, and setting up alerts and mitigation measures.
Further, vibration data can also indicate potential hazards in asbestos-contaminated structures, such as wear and tear in the insulation systems of machines, helping guide safe demolition or remediation planning.
Common Vibration Signature Patterns and What They Mean
To link some of the common vibration signature patterns to the risk they pose, here’s a simple table:
| Vibration Pattern | Possible Cause | Risk Level | Maintenance Action |
|---|---|---|---|
| High-frequency Spike | Bearing wear | Medium to high | Inspect and/or replace bearings |
| Low-frequency Wobble | Imbalance or misalignment | High | Rebalance equipment |
| Rhythmic Pulsing | Looseness or structural faults | Medium | Tighten or fix supports |
| Amplitude Variation | Motor or gearbox issue | Medium to high | Service the motor and gearbox |
Table 1: Common Vibration Signature Patterns and Fault Indicators
Further, based on the faults, the vibration signature patterns are as follows:
| Fault | Signature in Frequency Spectrum | Notes |
|---|---|---|
| Unbalance | A large, prominent peak at the 1x running speed | High radial vibration with a constant amplitude and phase angle, where the amplitude increases significantly with operating speed. |
| Misalignment | A dominant peak at 2x running speed | High axial vibration, especially when compared to radial readings. |
| Mechanical Looseness | Peaks at half-harmonics and higher harmonics | Vibrations may decrease with increased machine load. |
| Bearing Defects | High-frequency noise that appears at specific, calculated “defect frequencies” | Envelope analysis is often used to isolate these high-frequency impacts, making them easier to detect early. |
| Gear Problems | A peak at the gear mesh frequency (GM) and its harmonics, often with sidebands surrounding the GM peak. | The gear mesh frequency is calculated as (Shaft RPM) x (Number of teeth). Problems include worn, chipped, or broken gear teeth. |
| Resonance | High vibration amplitude occurs when the machine’s operating frequency matches one of its natural frequencies. | It can be identified during machine startup or shutdown by observing a peak as the machine passes through its critical speed. |
| Electrical Issues | Peaks at 1x, 2x, or multiples of line frequency. | Problems can include eccentric air gaps, bent shafts, or loose windings. Electrical issues will disappear immediately upon power disconnection. |
| Cavitation | A broadband “haystack” of high-frequency energy, typically between 3–5 kHz. | Caused by the formation and collapse of vapor bubbles in a fluid, such as in a pump. It can also be identified in the time waveform by random, noisy, high-frequency impacts. |
| Belt Problems | A peak at the belt’s rotating frequency (belt speed divided by belt length), often with harmonics and sidebands. | Caused by worn, damaged, or loose belts. A serious condition can cause high amplitudes. |
| Soft Foot | A strong 1x running speed peak that significantly decreases when one hold-down bolt is loosened. | This occurs when a machine’s foot is not flush with its base, causing distortion in the frame. The condition can be mistaken for misalignment. |
Table 2: Faults and Their Respective Vibration Signatures
How to Collect and Analyse Vibration Data
Vibration data collection and analysis go through the following steps:
- Establish a comparison baseline under normal operating conditions.
- Choose your preferred vibration collection method, such as periodic (handheld/spot checks) and continuous monitoring (automated sensors + cloud analysis).
- Place the sensors, such as accelerometers, velocity sensors, and piezoelectric sensors, in optimal locations.
- Gather data across every operating state (normal operation, startup, shutdown, etc.).
- Process the raw waveform data using algorithms like Fast Fourier Transform (FFT).
- Identify key features like harmonics, sidebands, and synchronous peaks.
- Compare this to the baseline data and identify vibration frequencies to pinpoint specific mechanical problems.
- Use different measurement parameters to understand different types of faults.
- Based on this, you can diagnose faults, implement corrective measures, and set alarms and thresholds for vibration levels.
Maintenance Decisions Based on Vibration Signatures
Interpreting vibration data helps prioritise and plan maintenance tasks, enabling technicians to take a predictive approach rather than a reactive one. These decisions can be as small as scheduling minor adjustments to as major as opting for a complete overhaul.
Vibration Amplitude
This is an indicator of a fault’s severity.
- Slightly higher than baseline amplitude indicates a fault in its earliest stages.
- Moderately increasing amplitude is your prompt to plan maintenance activity.
- If it exceeds the alarm threshold, there is a need for immediate action.
Frequency Signatures
The frequency of a vibration signal helps identify the faulty component
- Vibration at 1x Speed: perform the mechanical balancing procedure
- Vibration at 2x Speed: perform shaft or coupling alignment
- High Frequency Spikes: replace bearing and check lubrication
- Multiples of Running Speed: inspect and tighten mounting bolts, foundations, and supports
- Gear Mesh Frequencies: check the gearbox for worn or cracked teeth, lubrication issues, and gear backlash
- Resonance: determine the source, dampen natural frequency, and adjust operating speed
Strategic Maintenance Decisions
Beyond specific faults, vibration signatures also provide data for high-level strategic planning, which includes:
- Scheduling predictive maintenance via condition monitoring.
- Root cause analysis using specific fault signatures.
- Asset lifecycle management through historical vibration data.
Based on the vibration indicator, the recommended maintenance action plans are as follows:
| Vibration Indicator | Recommended Maintenance Action | Urgency |
|---|---|---|
| Early-stage imbalance | Schedule a routine inspection | Low to medium |
| Bearing degradation | Preemptive part replacement | Medium |
| Structural vibration | Engineering inspection required | High |
| Gearbox anomalies | Immediate shutdown and assessment | Critical |
Table 3: Vibration Data to Maintenance Action Guide
Vibration Monitoring in Sensitive Environments
Vibration monitoring is essential in sensitive environments like asbestos-remediated buildings, mining sites, and waste cleanup zones. The vibration and noise monitoring solutions can also be tailored to hazardous sites, ranging from asbestos remediation to oil spill response.
This enables early detection of potential hazards as well as early detection of structural or equipment vibration, which is vital for safe industrial applications.
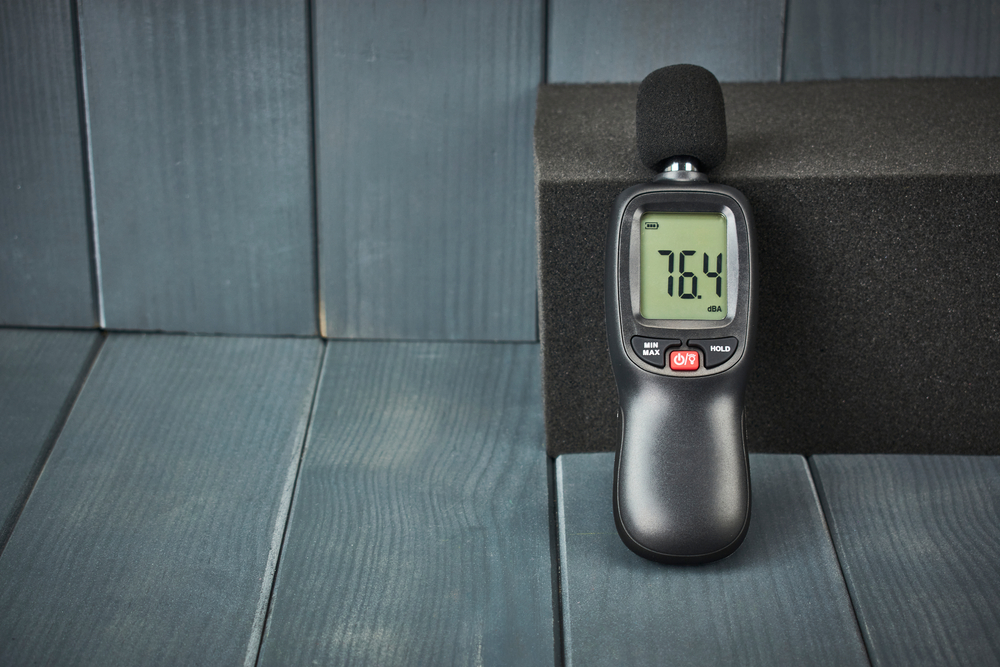
Further, noise and vibration monitoring also supports environmental impact reports (EIRs) or compliance documentation and standards, including WHS regulations for risks and concerns related to whole-body vibration (WBV) and hand-arm vibration (HAV).
For instance, the Exposure Action Value (EAV) for HAV is 2.5m/s2 and the Exposure Limit Value (ELV) is 5.0m/s2. Similarly, for WBV, EAV is set at 0.5 m/s2 and ELV is set at 1.15 m/s2. Vibration monitoring helps adhere to these, maintaining safe working conditions.
Integration with Other Monitoring Systems
The data from vibration monitoring systems can complement those from others, like:
- Noise monitoring
- Dust and air quality monitoring
- Ground movement detection
The combined systems can enable holistic site monitoring, which will lead to safer and more efficient remediation.
Final Thoughts
Vibration signatures are vital tools in maintenance planning and hazard prevention. Tracking and analysing vibration signatures enables cost savings, early fault detection, and environmental safety. It also helps meet compliance and worker safety norms in various industries.
Effective Maintenance Decisions Through
Need expert support for your site’s monitoring and maintenance? Take up vibration and noise monitoring with vibration signature for high-risk and regulated environments.
Frequently Asked Questions
How Often Should Vibration Monitoring Be Done?
It depends on the risk level, but high-use machinery should be monitored at least monthly or with continuous sensors.
Can Vibration Analysis Detect Hidden Structural Issues?
Yes. Unusual vibrations can signal looseness or cracks not visible externally.
Is Vibration Monitoring Mandatory in Australia?
It may be required under WHS regulations, especially in high-risk remediation zones.
How Does Vibration Affect the Industrial Environment?
Vibration leads to equipment damage, reduces productivity, and can also negatively impact worker health and safety.


